This post will go back over some of the highlights of the Blizzard of 2016 with a brief summary of why it happened, some of the reasons why plenty of snow fell where it did and some of the cool visuals that came out of the storm.
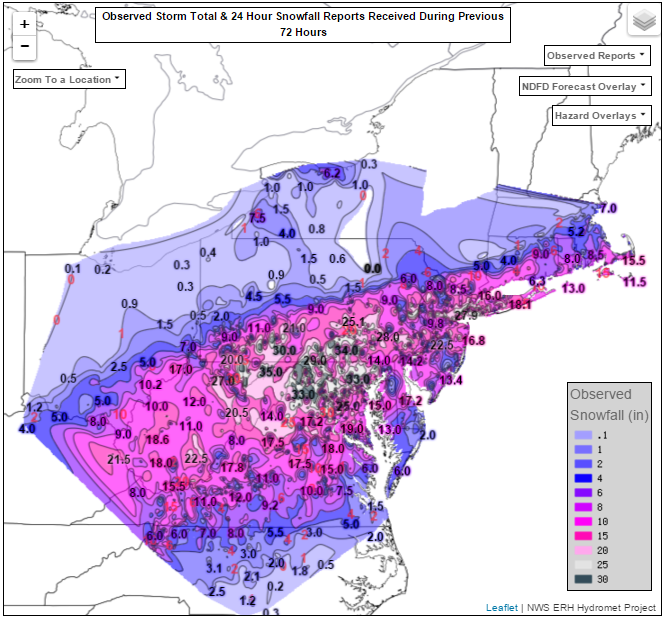
The storm had many interesting features that helped it become what it was. It started out over the Pacific Ocean and came onto the United States. As the energy energy ejected out of the Rockies, another low pressure system was entering the West Coast and causing a wave break. This would cause the high pressure ridge to develop behind the storm allowing plenty of cold air to wrap in behind the storm and rapidly develop the storm into a cutoff low even before it exited the East Coast.
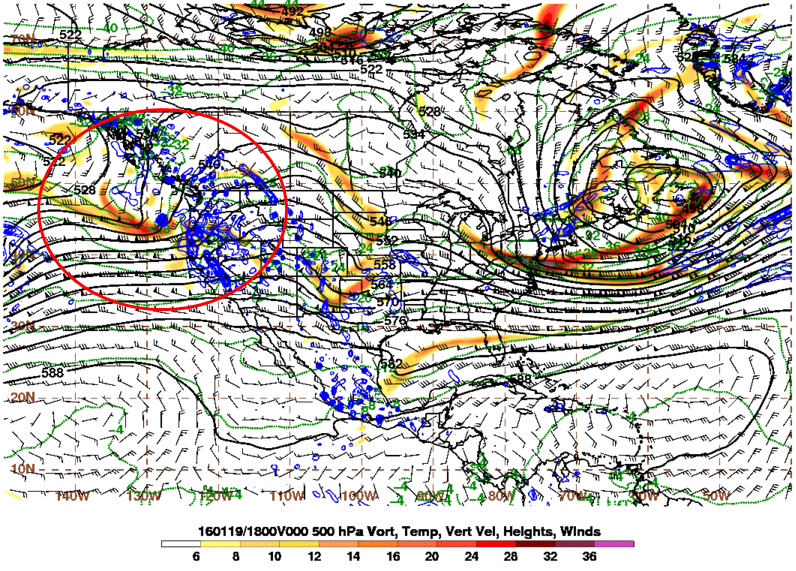
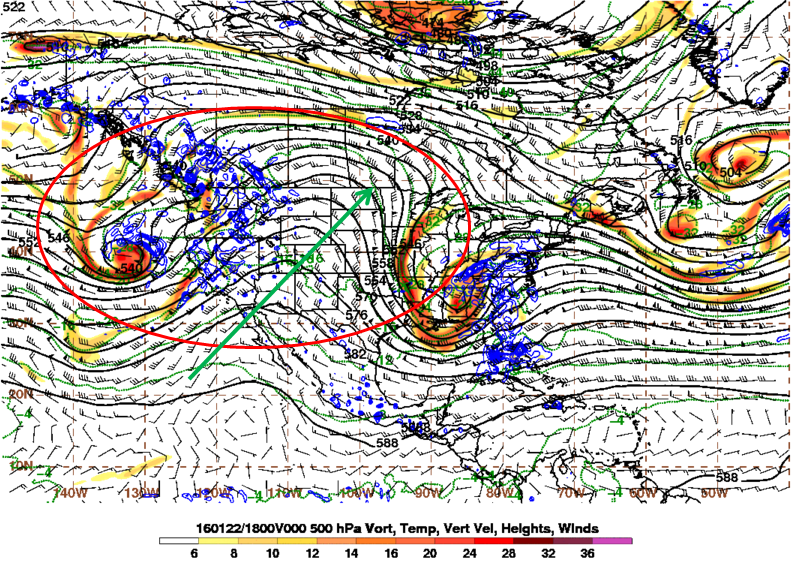
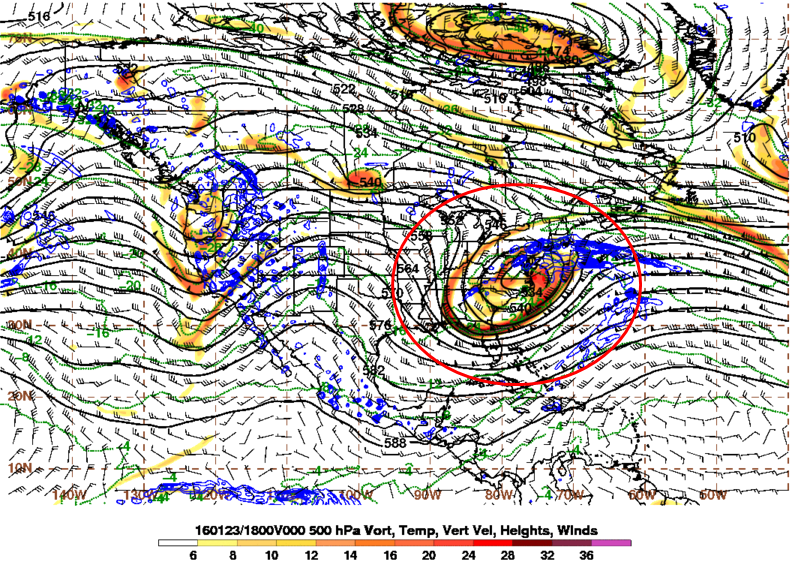
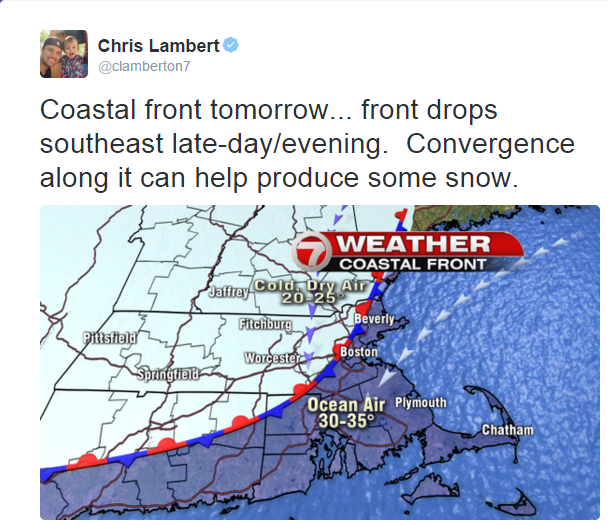
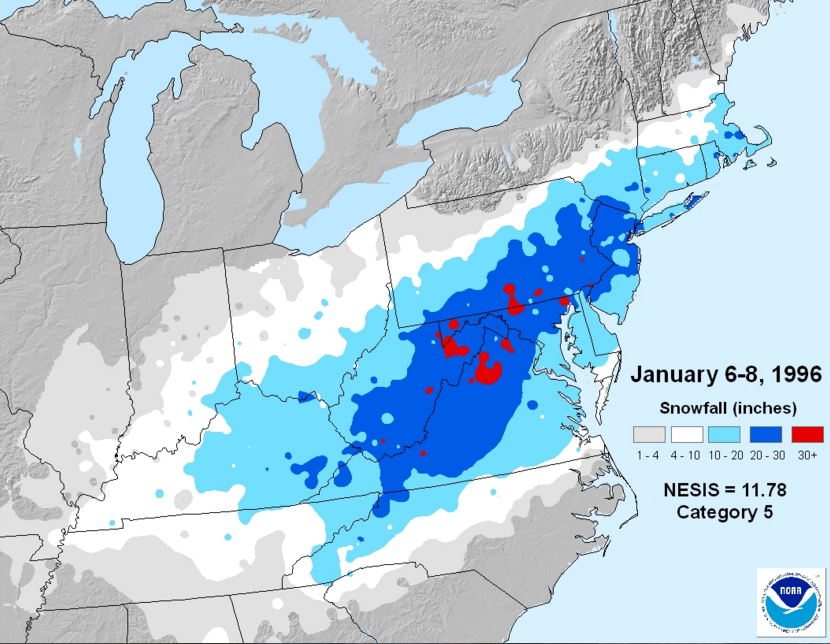
In fact, there was plenty of “wait for the energy to come on shore” phrases being dropped in the meteorological community because the models had the storm on the map for such a long time. However, the snow maps being generated by the models didn’t really give meteorologists much confidence along the way because there were plenty of differences in how far north the snow would come into the Northeast. It was a given that the storm would drop plenty of snow in the Mid-Atlantic since one of the most similar analogs or similar storms to this storm was the January 1996 Blizzard. This storm had areas of 20+ inches in the Mid-Atlantic, but had way too much snowfall in the Northeast. Meteorologists needed to pin point where the banding would set up. This occurred in a coastal front and another band system called a bent back warm front or TROWAL signature. It had plenty of moisture within it and as the storm was cycling and the moisture was wrapping into the storm, the bent back warm front would slowly pivot from a west to east signature to a northeast to southwest signature and then pivot out to sea as the storm passed by New England to the southeast. One wrinkle leading up to the storm had the model that is easy to disregard, the NAM, adjusted moisture way up for the New York region and many final snow maps didn’t include it because it was such an outlier. In fact, many areas over performed as a result of the bent back warm front band along the South Coast of Southern New England and the Coastal front over Southeastern Southern New England. So taking the NAM into consideration in some way may have actually helped.
Coastal flooding would be a huge problem along the East Coast:
This is happening right now in Ocean City, New Jersey #blizzard2016 pic.twitter.com/7gISbgonYe
— Cecily Tynan (@CecilyTynan) January 23, 2016
Some pictures and interesting photos:

Rare #thundersnow visible from @Space_Station in #blizzard2016! #Snowzilla #snowmaggedon2016 #YearInSpace pic.twitter.com/l3p6hjnJOq
— Scott Kelly (@StationCDRKelly) January 23, 2016
Astronaut Scott Kelly’s photograph from space of thundersnow.
AMAZING snowfall differences over just 50 miles! Hazleton, PA big winner in our area. #Blizzard2016. pic.twitter.com/OhJS9ldA9r
— NWS Binghamton (@NWSBinghamton) January 24, 2016
It was a case of the haves and have-nots as relatively small distances separated high and low snowfall totals.
PHOTOS: People who should wear more clothes during #blizzard2016: https://t.co/eQuKrd8JsO (Pic: @broshan11) pic.twitter.com/kW47vyeVcS
— Eyewitness News (@ABC7NY) January 23, 2016
After a while, you’ve gotta have fun with it.
Snow and no snow – pretty easy to pick out on this morning's visible satellite image. pic.twitter.com/BVGYElXNMk
— Ryan Hanrahan (@ryanhanrahan) January 24, 2016
The morning after’s visible satellite imagery distinctly showing the snowline.